Status of CCAP actions
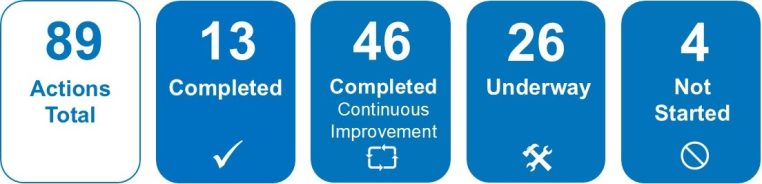
As of Winter 2026 out of 89 actions:
- 59 actions have been completed, including 46 continuous improvement actions
- 26 actions are underway
- 4 actions have not been started
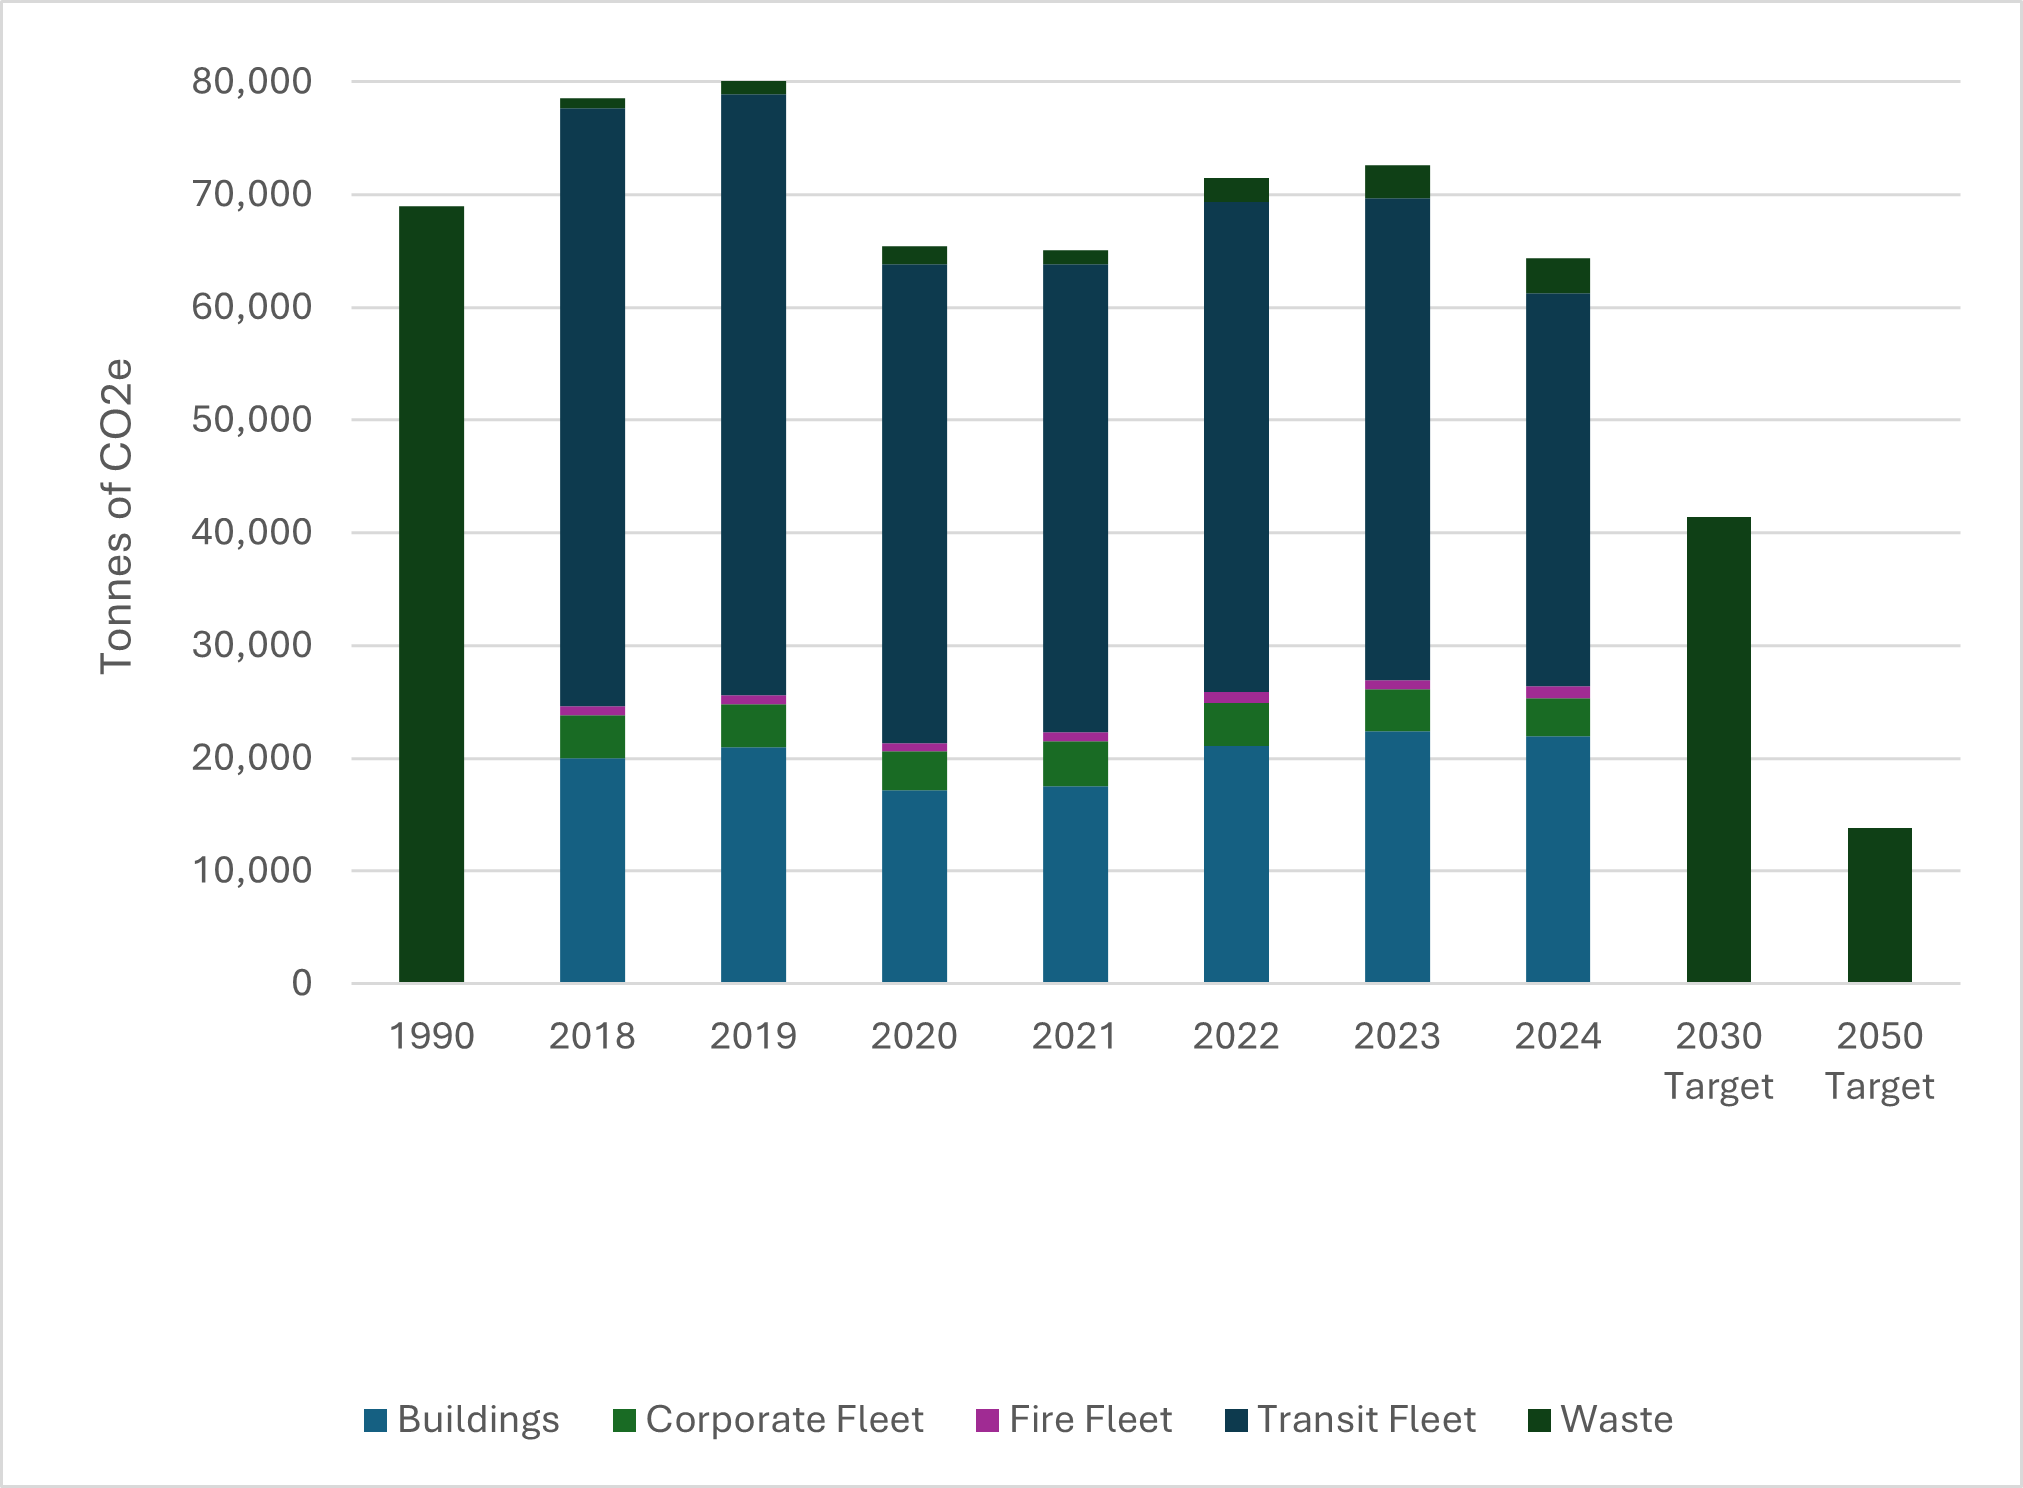
Greenhouse gas emissions in the corporation
There are five main sources of GHG emissions from municipal operations and services. The main sources and the percentage of GHG emissions they account for include:
- MiWay transit (54%)
- Municipal buildings (34%)
- Fleet (7%)
- Waste (5%)
In 2024, total GHG emissions for the corporation was 64,400 tonnes of carbon dioxide equivalent. This equals a 7% increase for corporate emissions based on 1990 levels and a 20% decrease since the CCAP was approved in 2019.
Greenhouse gas emissions in the community
Within the entire City, there are four main sources of GHG emissions. The main sources and the percentage of GHG emissions they account for include:
- Buildings (53%)
- Transportation (34%)
- Industrial processes (10%)
- Waste (2%)
In 2024, total GHG emission for the community was 6,940,675 tonnes of carbon dioxide equivalent. This equals an 12% reduction below 1990 levels and an 8% decrease below 2019 levels, which was the year CCAP was approved.
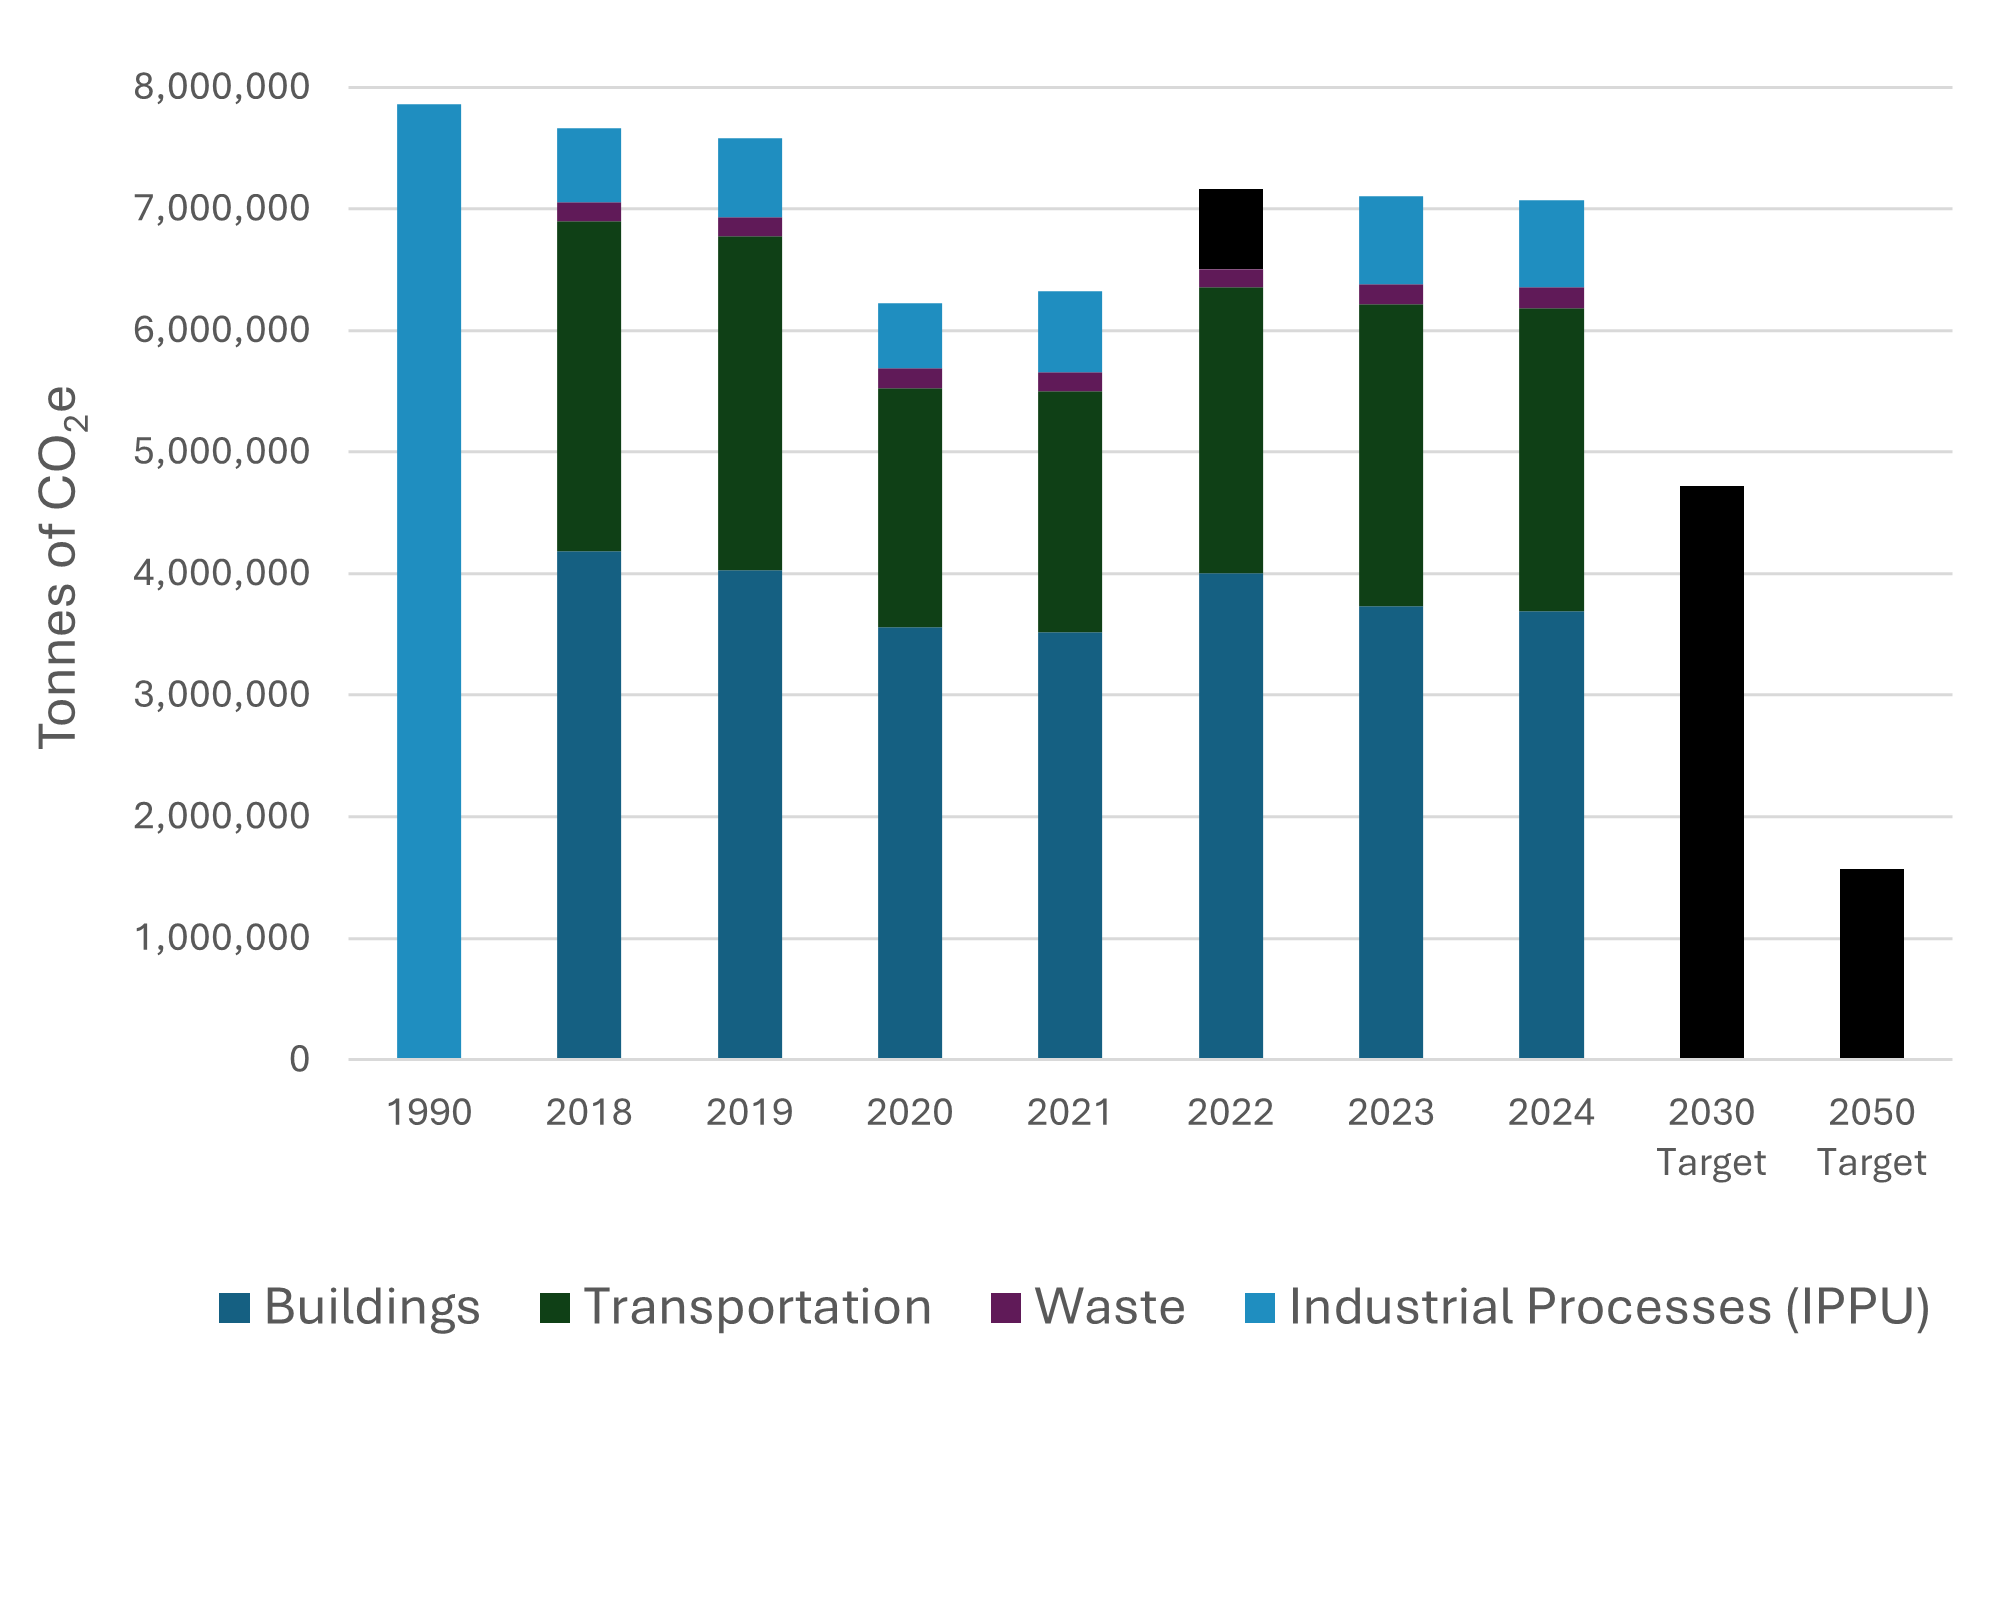
Buildings (53%) still accounts for the largest source of emissions for the City. This is further broken down into Residential (28%), Commercial (28%), and Industrial (44%). The distribution is consistent with previous years.
The City uses on Environment Canada’s National Inventory Report (NIR) as a primary source of its emission factors which is necessary in calculating GHG emissions. Environment Canada releases the NIR two years after a given calendar year (i.e. the 2022 emission factors were released in 2024). The City updates its previously reported annual emissions estimates using best available emission factors, including emissions from previous inventory years.
Enbridge Inc. and Altra Utilities supply aggregated consumption data to develop the inventory.
All greenhouse gas (GHG) numbers are currently unaudited by a third party.